Dynamically Consistent Ensemble of Temperature (DCENT) is an ensemble of historical Earth surface temperature estimates since 1850. DCENT has sophisticated bias adjustments and comprehensive uncertainty quantification. It provides a clearer picture for quantifying historical climate change at both global and regional scales, as well as for understanding climate variability and the dynamics behind it.
Annual Global Mean Surface Temperature (full coverage and non-infilled):
[1] Ensemble mean and 1 s.d. error in txt format.
Monthly Global Mean Surface Temperature (full coverage and non-infilled):
[1] Ensemble mean (full coverage) in txt format.
[2] Ensemble mean (non-infilled) in txt format.
[3] 200-member Ensemble in NetCDF format.
Annual Northern Hemispheric Mean Surface Temperature (full coverage and non-infilled):
[1] Ensemble mean and 1 s.d. error in txt format.
[2] 200-member Ensemble in NetCDF format.
Annual Southern Hemispheric Mean Surface Temperature (full coverage and non-infilled):
[1] Ensemble mean and 1 s.d. error in txt format.
[2] 200-member Ensemble in NetCDF format.
Gridded Monthly Temperature Product (non-infilled at monthly 5°x5° resolution):
[1] Ensemble mean in NetCDF format.
[2] 200-member Ensemble in NetCDF format.
[3] 1982--2014 Climatology in NetCDF format.
How to cite the dataset?
Chan D., Gebbie G., Huybers P., & Kent E. (2024). A Dynamically Consistent ENsemble of Temperature at the Earth surface since 1850 from the DCENT dataset. Scientific Data, link, pdf.
A story of the development of DCENT
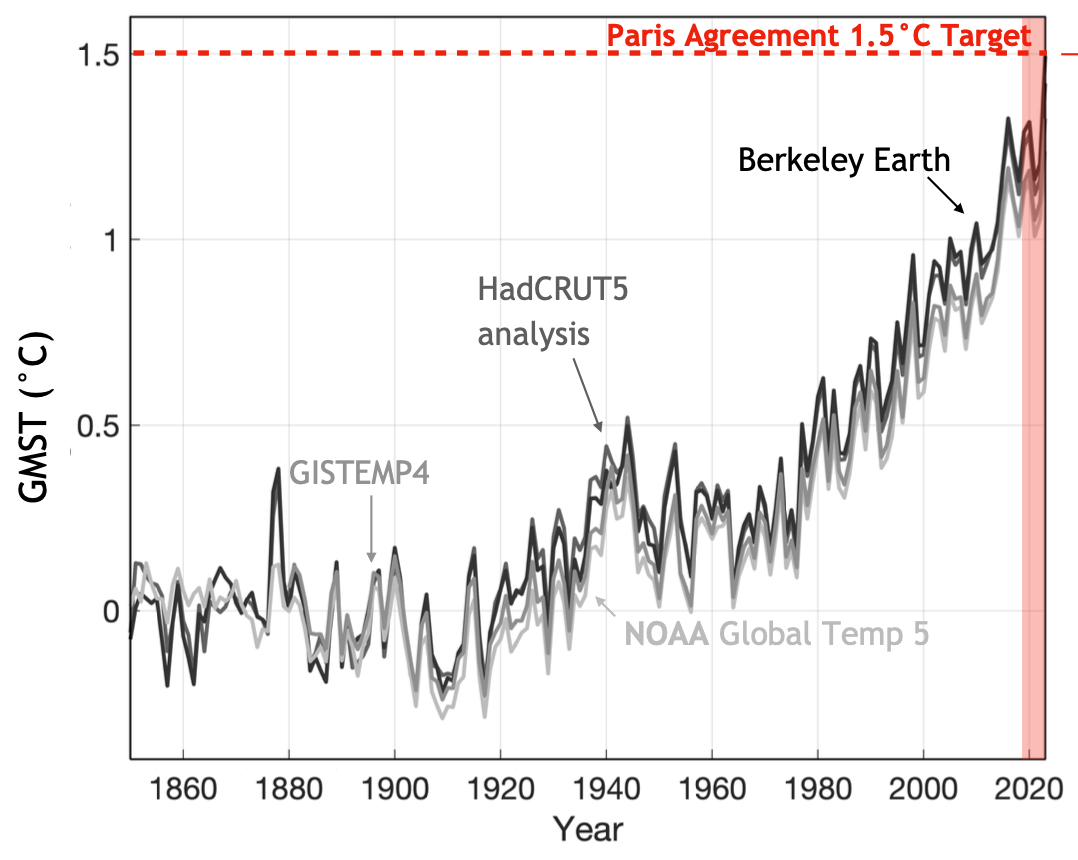
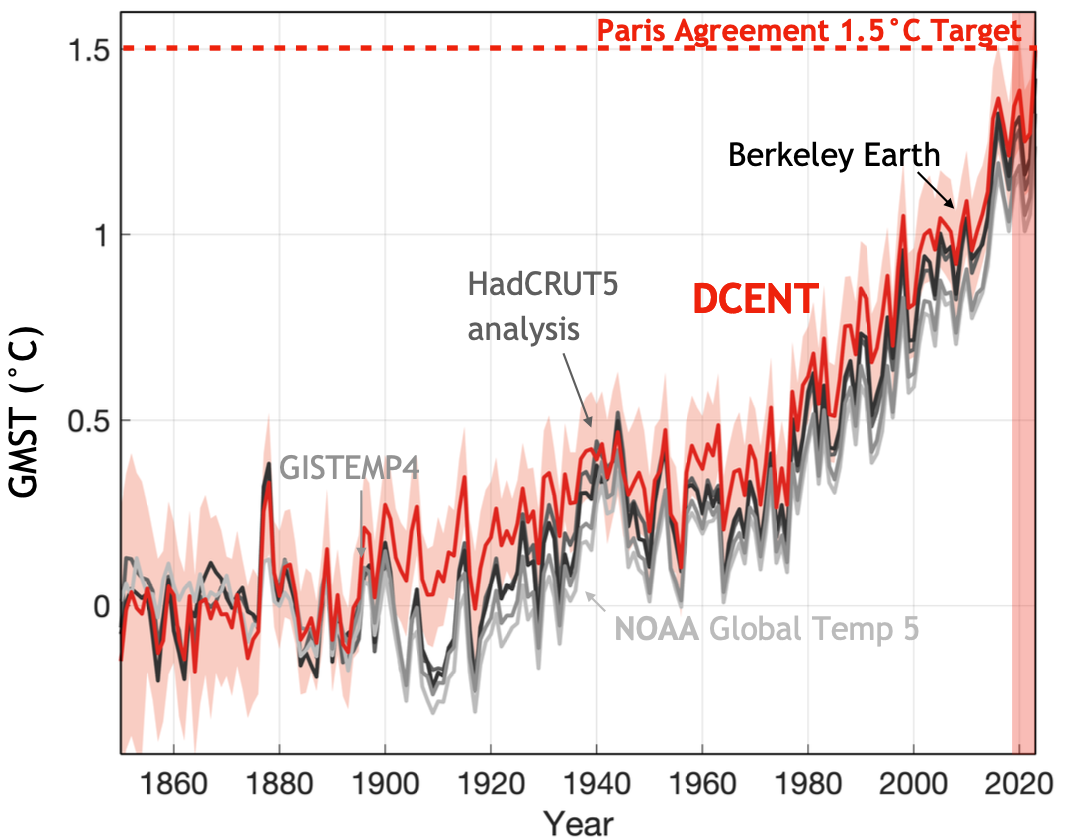
The most updated global mean surface temperature (GMST) estimates suggest an increasing GMST since the 1850s, with 4-stage decadal variability on top of the overall warming. As of 2023, the period from 2019 to 2023 is the warmest 5-year interval in instrumental history, with temperatures estimated to be 1.15 to 1.25°C warmer than the 1850ー1900 baseline. Compared with the Paris Agreement's target of limiting warming to within 1.5°C, the remaining margin is only a quarter of a degree Celsius.
However, these global mean temperatures consist of two components: land and ocean, which have historically been measured by different instruments, stored in different archives, and analyzed by different groups.
Although land and ocean temperatures have closely followed one another since 1946, they do not seem to be consistent before the 1940s. For example, during the early 20th century, the ocean warmed faster than the land. Yet, the land is expected to warm faster, as simulated by complex climate models, because it is more water-limited and hence loses less heat through evaporation. Such model-data discrepancies could potentially undermine the credibility of climate models and their predictions.
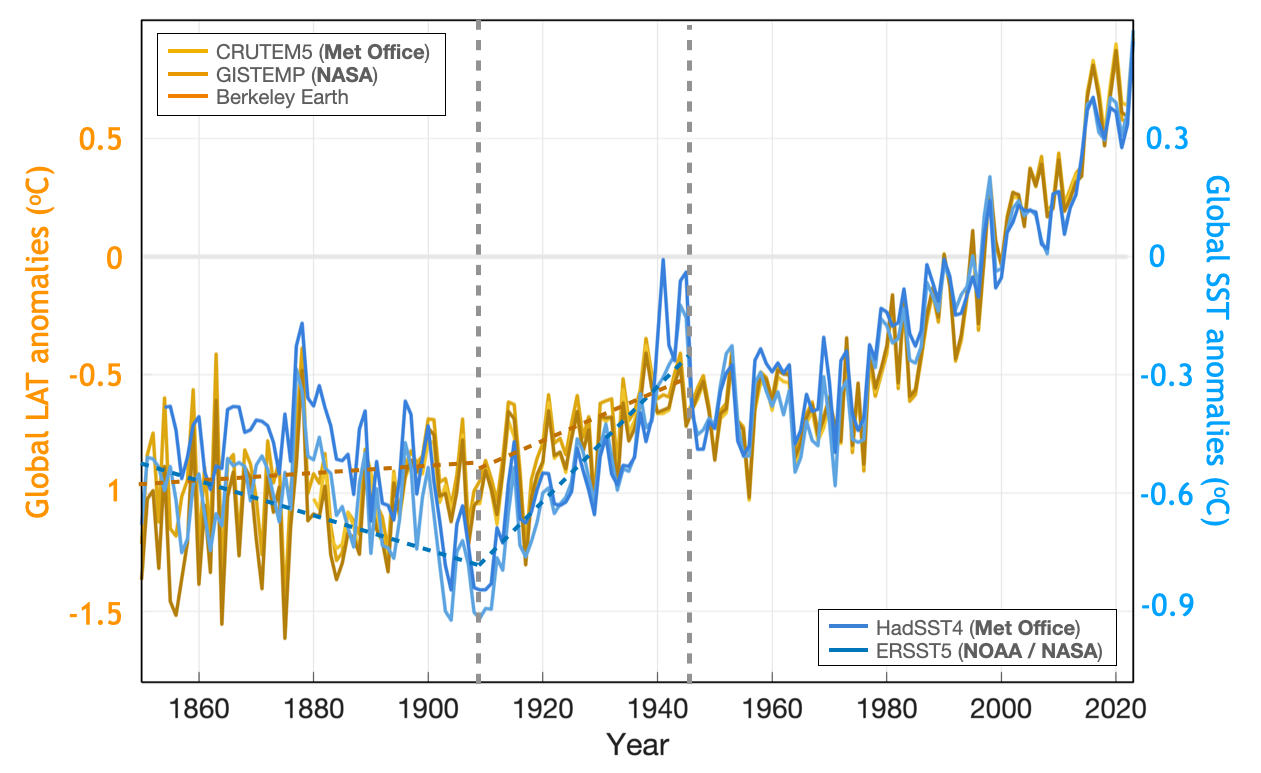
Models can always be imperfect, but instrumental records, especially the early ones, are no more trustworthy. The land temperatures, often represented as the air temperature 2 meters above the surface, are collected by weather stations and can contain breakpoints associated with changing instrumentation and moving stations. The sea temperature, usually measured as the water temperature in the upper 20-30 cm of the water column, can be biased due to non-expert measurement approaches, such as using buckets (see here for more details).
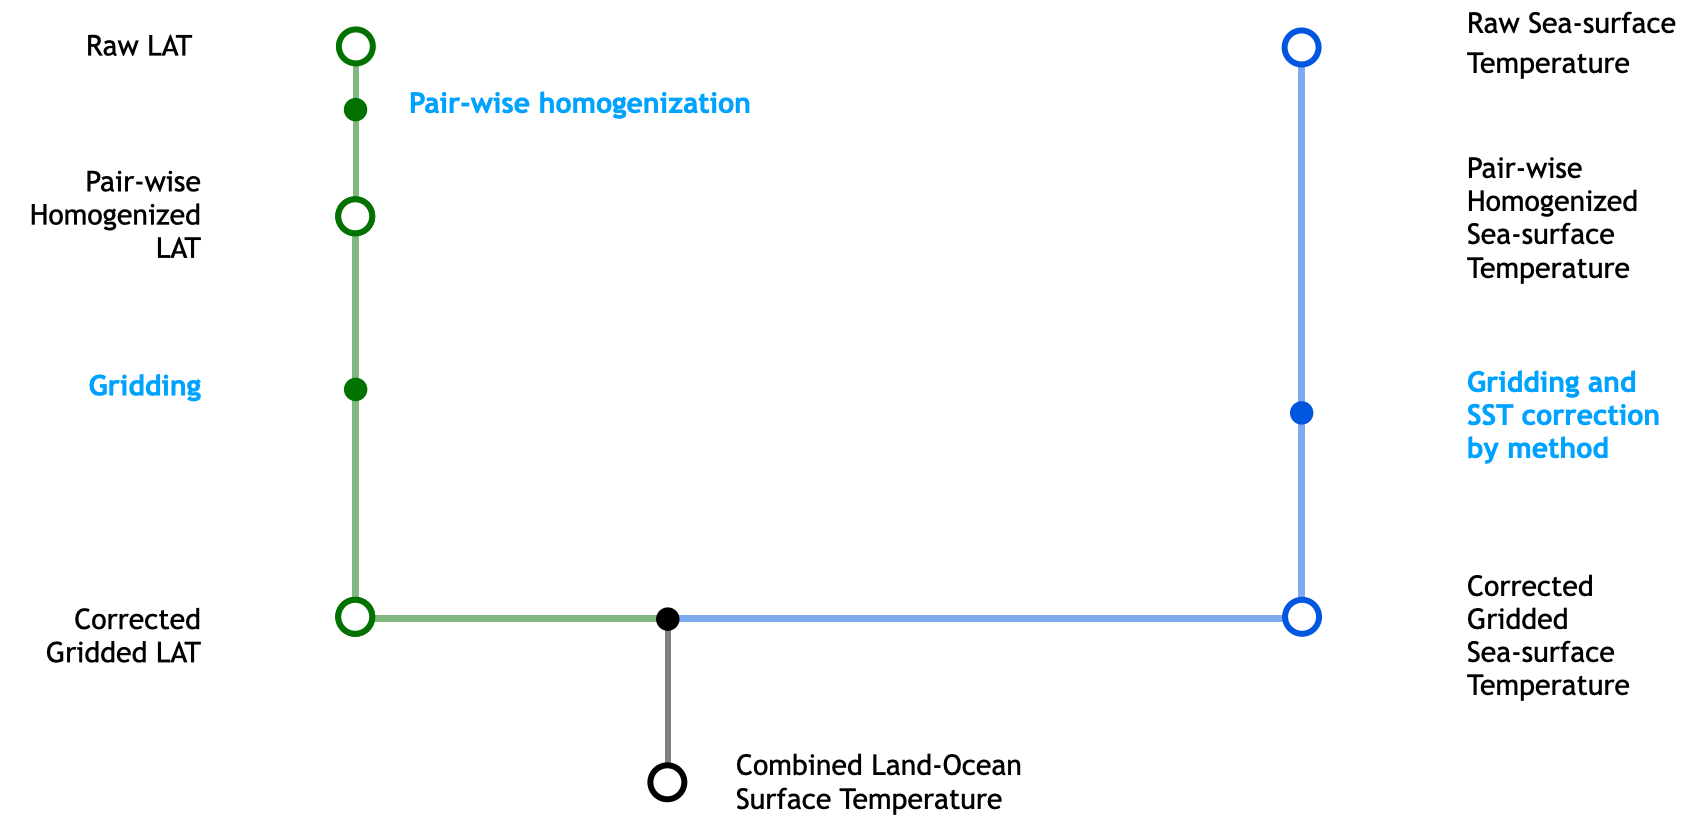
Existing datasets have, of course, accounted for these data issues to some extent, but with some limitations. For example, Menne et al. (2009, 2018) developed pairwise homogenization algorithms to detect and remove breakpoints in station temperatures, although the null hypothesis of the key statistical test used to detect breakpoints is derived from white noise series. Kennedy et al. (2019) corrected sea-surface surface temperature (SST) records by measurement methods, although they assumed that data from the same year and method are biased in the same way. It is also worth noticing that land and ocean temperatures were processed in parallel and independently.
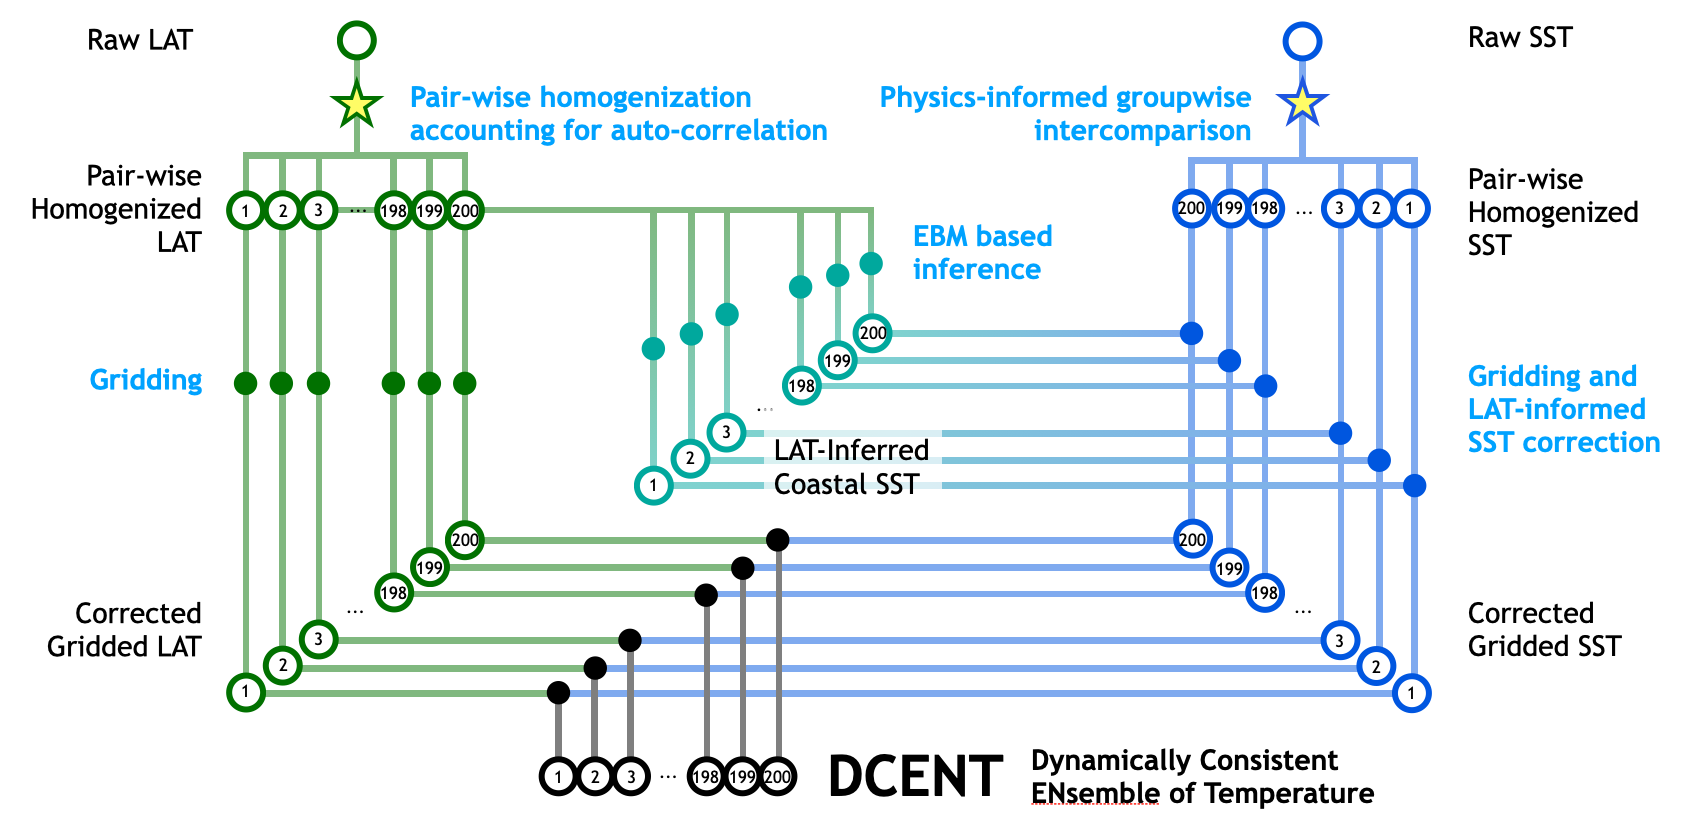
Therefore, our goal is to systematically improve the bias correction process for the land and sea temperature archives and also for the inter-calibration between the two data archives. Specifically, we made three improvements detailed below:
[1] We improved the land station homogenization by accounting for auto-correlation in the detection algorithm, since monthly temperatures at individual stations are correlated over time (Chan et al., 2024a). The improved method detects more actual breaks and fewer false identifications, leading to a colder baseline temperature and a larger warming trend on land. A quick story is in the video below.
[2] Different groups of ships could have deployed different instruments, or used the same instrument differently. To assess how SSTs collected by various nations or ship groups might systematically differ, we developed a group-wise intercomparison framework (Chan and Huybers, 2019). This method allows us to detect systematic offsets of up to 1°C among groups that were thought to contain bucket measurements, which has significant implications for the regional SST evolution. A related story is available in the video below. More details can be found on this page.
[3] Jones et al. (1986) proposed using coastal station temperatures to evaluate SST biases, but their contribution was forgotten until Cowtan et al. (2018) used linearly scaled land temperatures to infer SST evolution and evaluate SST biases. However, because land and ocean temperatures have different coupling schemes, heat capacity, water availability, and albedo, linear scaling may not be the best approach for such an inference. In Chan et al. (2023), we used a coupled energy balance model, which can capture different regimes of air-sea coupling, to perform a better inference and more appropriate comparisons. We found that land and ocean temperatures are not consistent along global coasts before 1940 at both global and regional scales. Further evidence from the diurnal cycles of SSTs and physical modeling of bucket biases suggests that this discrepancy mainly reflects under-corrected SST biases associated with changing instrumentations in the late 19th century.
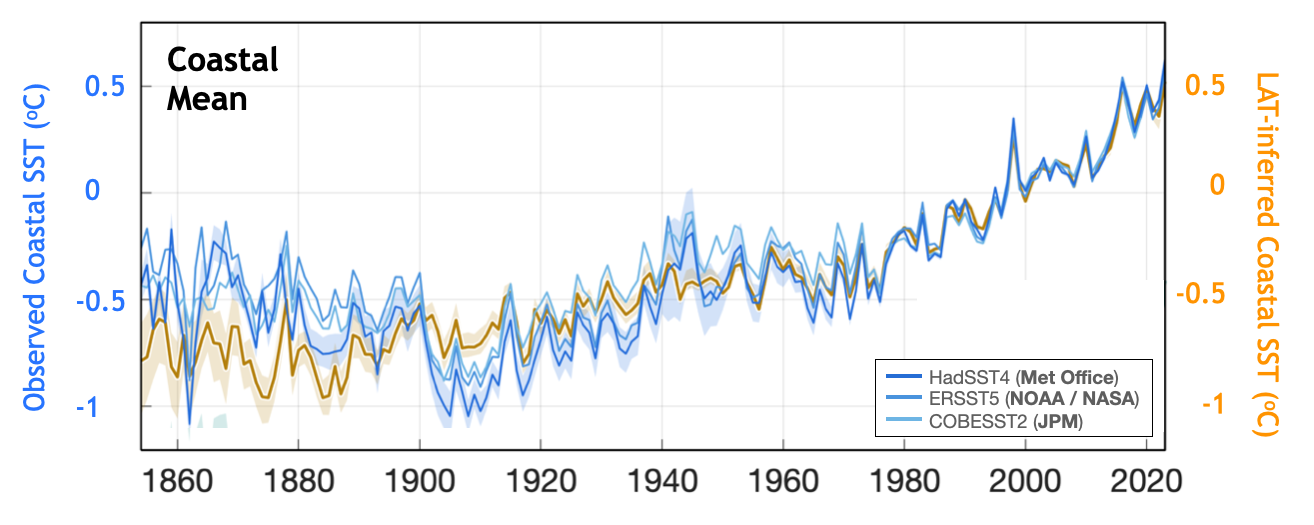
Implementing these improvements allows for the development of an ensemble of temperature estimates that contains dynamically consistent land and ocean temperatures and comprehensive quantification of uncertainty. We call this dataset the Dynamic Consistent Ensemble of Temperatures (DCENT; Chan et al., 2024b).
DCENT suggests a steadier and faster warming since 1850 compared with existing estimates (Chan et al., 2024c). Our revised estimate shows a three-stage decadal variability that aligns better with expected warming based on external radiative forcing. These estimates also become more consistent with paleo proxies from tree rings and coral reefs. Equally important, we estimate temperatures over 2019 to 2023 to be 1.36°C warmer than the late 19th century baseline, which is approximately 10% faster than existing estimates. This implies an earlier exceedance of the 1.5°C target before 2030, regardless of emission scenarios.
- Chan D., Gebbie G., & Huybers P. (2024a). An improved ensemble of land-surface air temperatures since 1880 using revised pair-wise homogenization algorithms accounting for autocorrelation. Journal of Climate , 37(7), 2325-45. link, pdf, code & data
- Chan D., Gebbie G., Huybers P., & Kent E. (2024b). A Dynamically Consistent ENsemble of Temperature at the Earth surface since 1850 from the DCENT dataset. Scientific Data . link, pdf, data, code
- Chan D., Gebbie G., & Huybers P. (2024c). Larger and Steadier Warming since 1850 from Harmonized Land and Ocean Temperature Records. Earth arXiv . link,
- Chan D., Gebbie G., & Huybers P. (2023). Global and Regional Discrepancies between Early 20th Century Coastal Air and Sea-Surface Temperature Detected by a Coupled Energy-Balance Analysis. Journal of Climate, 34(9), 2205-20. link, pdf, code & data
- Chan D. & Huybers P. (2019). Systematic differences in bucket sea surface temperature measurements amongst nations identified using a linear-mixed-effect method. Journal of Climate, 32(5), 2569-2589. link, pdf, code
- Sippel S., Kent E.C., Meinshausen N., Chan D., et al. (2024). Early-twentieth-century cold bias in ocean surface temperature observations. Nature . link, pdf, News.