Sea-surface temperature (SST), typically defined at a depth of 20–30 cm of the ocean, is a crucial quantity for studying the Earth's climate. However, we do not yet have accurate, persistent, and stable historical SST records to fully understand climate change in the modern period.
In fact, historical SST records are full of biases and errors. Those before the 1980s were mostly collected by voluntary sailors using a variety of crude instruments that are distinctly biased, such as buckets (see the video below). Moreover, the data archive (ICOADS) containing these biased measurements was also put together, piece-by-piece, by different projects since the 1960s. When data were transferred across storage technologies, arbitrary management choices, such as truncation, were made due to limited storage capacity. These practices have led to biases in SSTs on the order of 0.5°C globally and more than 1°C locally, constituting a major gap in quantifying modern climate change that was only on the order of 1°C globally throughout the 20th century.
How to measure SSTs with a bucket? Ocean Weather Ship Record B (1947) from Youtube
Existing corrections (Folland and Parker, 1995; Kennedy et al., 2011) are mostly physically based but are over simplified because of the limited amount of metadata. These corrections often assumes that all bucket measurements in the same year are biased in the same way as if they were measured by the same person using the same bucket, but bucket biases would depend on the types of buckets being used and the measurement protocols being followed.
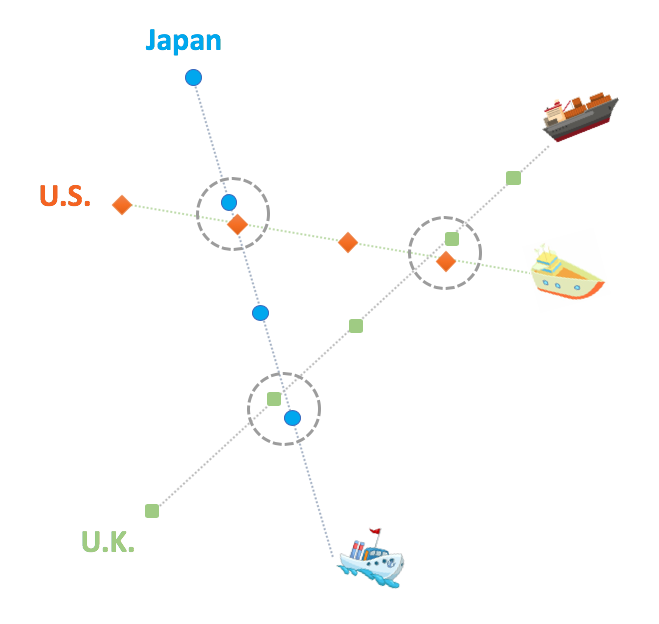
Our goal is to achieve more refined SST corrections by better resolving differences between individual subsets of data associated with, for example, different instruments, nations, purposes of ships, and post-processing projects.
Unlike existing physically based methods that are limited by the quality of metadata, we develop a statistical framework to estimate detailed bias structures directly from hundreds of millions of records. The method relies on inter-comparing nearby measurements from different data subsets and allowed us to detect statistically significant differences between nations and data collecting groups (Chan & Huybers, 2019).

In addition to the statistical method, we also used physical simulations and evidence from historical documents to show that these statistically quantified national SST biases contain both physical biases during measurement and data management errors during digitization (Chan et al. 2019, Chan and Huybers, 2020).
Correcting groupwise SST offsets substantially improves the quality of historical SSTs and provides important new insights for understanding past climate change. Below are three examples:
[1] Correcting for groupwise offsets for bucket SST leads to more homogeneous early 20th-century SST warming (Chan et al., 2019), indicating the dominating role of anthropogenic activities, compared with natural variability, in the early 20th century. A quick story is in the video below.
[2] The second example is a significant but unexplained warm SST anomaly during World War II (Fig. 3a), which we found to reflect mainly biases associated with unusual wartime measurement practices (Chan and Huybers, 2021). These findings reveal a simpler temperature evolution that is more in line with our current knowledge of climate forcing and variability.
[3] Correcting SSTs also improves the simulation of Atlantic hurricane activity throughout the late 19th and 20th century (Chan et al., 2021), which also increases our confidence in current models and points to the importance of accurate predictions of SST patterns for hurricane projections.
- Chan D., Vecchi G., Yang W., & Huybers P. (2021). Improved simulation of 19th- and 20th-century North Atlantic hurricane frequency after correcting historical sea surface temperatures. Science Advances, 7(26), eabg6931. link, pdf, code, data
- Chan D., & Huybers P. (2021). Correcting sea surface temperature observations removes World War II warm anomaly. Journal of Climate, 34(11), 4585-4602. link, pdf, code, data
- Chan D.. (2021). Combining statistical, physical, and historical evidence to improve historical sea surface temperature records. Harvard Data Science Review, 3(1). link, pdf
- Chan D., & Huybers P. (2020). Systematic differences in bucket sea surface temperatures caused by misclassifications of engine room intake measurements. Journal of Climate, 33 (18): 7735–7753. link, pdf, code
- Chan D., Kent E., Berry D. & Huybers P. (2019). Correcting datasets leads to more homogeneous early 20th century sea surface warming. Nature , 571, 393-397. link, code, data, Harvard Gazette, NPR news
- Chan D. & Huybers P. (2019). Systematic differences in bucket sea surface temperature measurements amongst nations identified using a linear-mixed-effect method. Journal of Climate , 32(5), 2569-2589. link, pdf, code
- Kennedy, J. J., Rayner, N. A., Smith, R. O., Parker, D. E., & Saunby, M. (2011). Reassessing biases and other uncertainties in sea surface temperature observations measured in situ since 1850: 2. Biases and homogenization. Journal of Geophysical Research: Atmospheres, 116(D14).
- Folland, C. & Parker, D (1995). Correction of instrumental biases in historical sea surface temperature data. Quarterly Journal of the Royal Meteorological Society 121, 319-367.